How to Read Wind on the Water: The Wing Foiler's On-Water Forecasting Guide
The Short Version
- Cat's paws — the dark ripple patches that appear when gusts hit the water — are more reliable than any forecast app for reading real-time wind direction and speed at the surface.
- Wind shadows from shoreline obstacles extend 5-10x the obstacle height offshore, meaning a 30-foot tree line can shadow 150-300 feet of water that looks windier than it actually is.
- Lake breezes on Great Lakes and Finger Lakes shorelines run opposite to synoptic model wind and typically peak at 15-16 knots between 1-3 PM on warm, low-forecast days — sessions the apps said wouldn't happen.
- Cross-chop from two intersecting wave directions reliably signals a recent wind shift; conditions usually stabilize within 20-30 minutes, so arriving at cross-chop often means improving conditions, not worsening ones.
- A 5-minute pre-session assessment — surface scan, three anemometer readings, ground-level tree check — gives better gear-selection information than any model prediction.
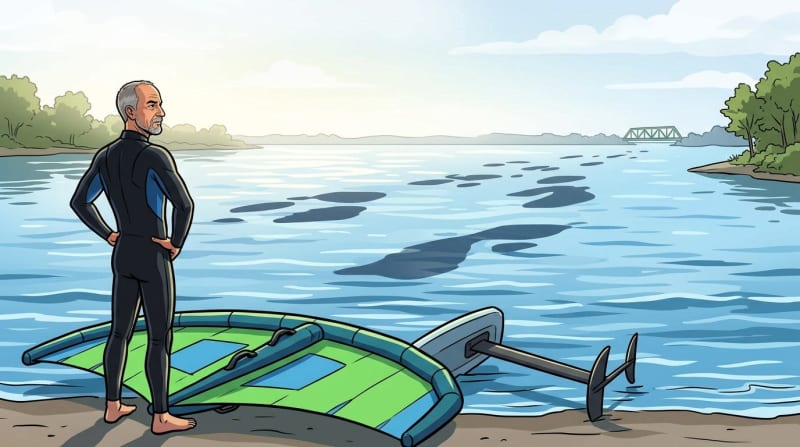
There's a moment every wing foiler knows. You checked the forecast three times this morning. Windguru said 18 knots. Windy agreed. You drove to the water with your kit loaded — and the lake is practically glassy. Not rippling. Glassy.
The model wasn't wrong, exactly. Somewhere, 18 knots exists — at 10 meters elevation over an open field, or two hours from now when the thermal kicks in, or five miles offshore where the shoreline stops blocking the flow. But here, at your feet, at your launch? The conditions are whatever they are, independent of what any algorithm predicted this morning.
learning how to read wind on water is the most underrated skill in wing foiling. It doesn't replace a good forecast. It completes it — and on the days when the forecast is most confidently wrong, it's the only tool that matters.
Why Forecast Tools Leave You Stranded (and What to Do About It)
Why Forecast Tools Leave You Stranded (and What to Do About It)
Windguru, Windy, and iKitesurf are forecast models. They process atmospheric data, run numerical weather prediction algorithms, and give you a probability distribution of what conditions might be at your general area at a predicted future time. They are excellent tools for deciding whether to drive to the water. They are not reliable tools for deciding whether to rig your wing.
The gap between forecast and reality is biggest in three situations: lake breezes (which run opposite to synoptic model winds), thermal effects in terrain (which create acceleration zones and dead spots the models smooth over), and wind shadows from local topography that no global model can resolve at the scale of your specific launch site. Each of these can produce a 10-15 knot difference between what the app shows and what you'll find on the water.
According to NOAA's lake breeze forecasting resources, lake breezes form when land heats faster than water — the air over land rises, and cooler air from over the water rushes in to fill the low pressure. This happens reliably on most inland lakes and Great Lakes shorelines from late morning through mid-afternoon on warm, low-synoptic-wind days. The result: model-forecast conditions showing 5 knots of southwest wind while you're standing on a southeast-facing shore watching a 12-knot lake breeze that no model predicted.
Here's how the Beaufort scale — formalized in 1838 as a systematic way to read surface conditions without instruments — maps to what you can observe from shore before you ever touch your wing:
Force 3 is where consistent ripples appear. Force 4 is where wing foiling on larger gear becomes viable for most riders. Force 5 is prime conditions on standard modern kit. The point isn't memorizing the scale — it's learning to see surface states and translate them into knot ranges before you rig. That translation is entirely available to you at the water's edge, with no app required.
Cat's Paws: Your Most Reliable Wind Indicator
Cat's Paws: Your Most Reliable Wind Indicator
Look at any water surface with partial wind coverage and you'll notice dark patches moving across what is otherwise lighter-toned rippled or flat water. Those are cat's paws — and according to experienced wing foilers and instructors at King of Watersports, they are the single most reliable real-time wind indicator available without instruments.
A cat's paw forms when a gust makes contact with the water surface. The gust ripples individual wavelets in a cluster — and because those wavelets are angled away from you at the moment of impact, they absorb light rather than reflecting it. The patch appears darker than the surrounding water. The effect is visible from shore, it appears and moves in real time, and it tells you things no forecast model can.
Watch cat's paws for five minutes from your launch before rigging anything. What you're looking for is direction, speed, and density. Cat's paws travel downwind — the direction they move is the actual wind direction at the water surface, which may differ from the forecast by 20-40 degrees when a thermal or lake breeze is active. Cat's paws crossing a fixed reference point at a walking pace suggest 10-12 knots; moving faster than a jog suggests 15 or more. Scattered cat's paws with calm patches between them mean gusty, variable conditions, while dense and continuous cat's paws covering the whole surface indicate steadier pressure.
Steady conditions are a completely different session from gusty conditions of the same average speed. your gear selection, your riding strategy, your decision about whether to go out at all — the density of cat's paws informs all of it better than any forecast timestamp.
The water is always more current than the forecast. Full stop.
What story are the cat's paws on your local water telling you that you haven't yet learned to read?
Glassy Patches, Wind Shadows, and What They Mean
Glassy Patches, Wind Shadows, and What They Mean
A glassy patch on otherwise rippled water isn't calm conditions — it's a boundary. Something is blocking the wind from reaching that area of the water, and that invisible architecture matters enormously for launch site selection and for understanding where you'll actually fly.
Wind shadows form in the lee of any obstacle: headlands, buildings, tree lines, dunes, cliff faces. According to King of Watersports, shadows can extend five to ten times the height of the obstacle downwind — meaning a 30-foot tree line on a point can shadow 150 to 300 feet of water that looks like it should be windier than it is. This catches newer foilers every time: the launch area looks fine from the parking lot, the wind feels light at the water's edge, and you can't figure out why — until you're 200 meters offshore and the wing suddenly fills.
Here's the practical math on wind shadow reach:
Reading the boundary between glassy and rippled water tells you approximately where active wind begins. Look for it from shore before rigging. If the boundary is close — say 50 meters out — you're carrying your wing through dead air before you get to fly. If the boundary is far offshore, your entire session area may be sheltered and the conditions you're hoping for are even further out.
The subtler version: wind shadows move. As wind direction shifts through the day — particularly when a thermal or lake breeze comes in — the shadow cast by a particular obstacle rotates with it. A tree line that was perpendicular to the wind at 9 AM might be sheltering your entire launch by noon. That's not a broken forecast. That's local topography doing what local topography does, and you can read it if you know what to look for.
Reading Whitecaps, Chop Direction, and Swell Patterns
Reading Whitecaps, Chop Direction, and Swell Patterns
Whitecaps are an upper-bound indicator. Their presence tells you the wind has crossed a threshold. Their absence doesn't tell you much except that you're below it.
According to NOAA's Beaufort scale reference, whitecaps begin appearing at approximately 10-12 knots and become consistent and widespread by 14-16 knots. When you can see regular whitecaps forming and collapsing across the water surface, you're looking at conditions in the 12-18 knot range — workable for most intermediate foilers on appropriate gear.
The more useful indicator is chop direction. Chop is driven by current wind. Swell is driven by previous wind — it propagates for hours after the wind that generated it has shifted or died. When chop and swell are running in different directions, the swell is showing you history, not current conditions. If you're planning your riding line based on swell direction and the wind has already shifted, you'll be fighting cross-chop that doesn't match your expectation.
Cross-chop itself — when you can see two distinct intersecting patterns of wave energy — is a high-confidence indicator that the wind has recently shifted or is actively gusty. According to US Sailing's weather resources, cross-chop patterns reliably signal recent or active wind shifts. The conditions typically smooth out within 20-30 minutes as the new wind direction takes over — which means cross-chop on arrival often signals improving conditions, not worsening ones. It's frequently worth waiting.
Here's how observable surface conditions map to approximate wind speeds:
Two conditions worth noting: choppy water with no whitecaps usually means variable 8-12 knot wind — enough to tempt you onto the water, not necessarily enough to stay flying efficiently. And whitecaps that appear and disappear in irregular intervals rather than forming consistently indicate gusty conditions with significant lulls. That demands a different approach than steady pressure at the same average speed — and knowing which one you're in before you rig changes everything.
Lake Breezes and Thermal Patterns: Great Lakes and Inland Lakes
Lake Breezes and Thermal Patterns: Great Lakes and Inland Lakes
If you wing foil anywhere in the Great Lakes basin — Lake Ontario, Lake Erie, Seneca Lake, any of the Finger Lakes — lake breezes are part of your riding season whether you've consciously studied them or not. They're the reason some of the best summer sessions happen in the early afternoon when the morning synoptic forecast showed nothing. They're also the reason sessions that "should" have worked by forecast died completely by 2 PM when the breeze shifted onshore and compressed.
The NOAA National Weather Service defines lake breezes as diurnal thermal circulations driven by the temperature differential between land and water. On a warm summer day, land heats rapidly, the air above it rises, and cooler, denser air over the water moves in to fill the resulting low pressure. This produces a distinct, locally-generated onshore wind that is essentially invisible to synoptic forecast models — which average conditions over spatial scales that smooth out everything that makes your specific shoreline interesting.
Lake breezes on the Great Lakes and Finger Lakes typically develop between 10 AM and noon on warm, low-synoptic-wind days, peak in the early-to-mid afternoon, and decay around sunset. US Sailing's instructional weather resources confirm the diurnal pattern: build from mid-morning, peak around 2-3 PM, fade by evening. Here's a typical summer day profile:
The session implication: when the forecast shows weak synoptic winds under 8 knots and the sky is clear, this is often the setup for a lake breeze window. Arrive around 10 AM and read the water. Cat's paws starting to appear from the lake direction, even against a light model wind from a different heading, tell you a lake breeze is building. These sessions often fire to 12-16 knots by 1 PM and are among the most consistent windows of the summer — short, sharp, reliable.
The riders who know this pattern — who understand that the model becomes increasingly irrelevant as the day heats up and trust what the water surface is showing them — consistently get on the water when others drive home. That knowledge lives in the community, not in the apps. It gets passed from experienced local riders to newer ones, and it takes a season or two of showing up and watching before it becomes instinct.
The Five-Minute Launch Assessment
The Five-Minute Launch Assessment
Everything above is only useful if you actually do it before rigging. Spending five minutes at the launch before you touch your wing is the habit that pays back every session.
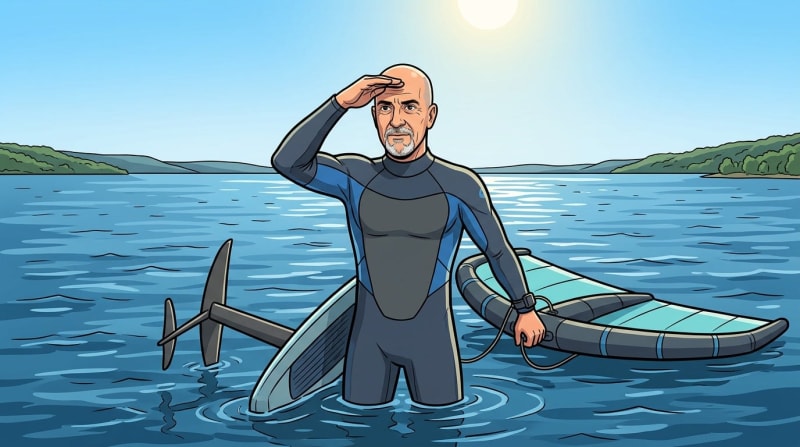
Start with a full water surface scan — about two minutes, looking across the entire expanse of water you can see. Identify where cat's paws are appearing and which direction they're traveling. Note any glassy patches and estimate where the wind shadow boundary is relative to your launch. Look for whitecaps — their presence, absence, or intermittent appearance gives you your rough wind floor and ceiling. This two-minute scan costs nothing and answers the most important question: is the forecast anywhere close to the ballpark?
Next, use a wind meter. A handheld anemometer — Kestrel makes the most widely-used models among wing foilers and kitesurfers — gives you a ground-truth number that no forecast can provide. Take three readings at 30-second intervals. Both the average and the spread matter. A session averaging 16 knots with readings ranging from 10 to 22 is a completely different experience than one averaging 16 knots with readings between 14 and 18. Same average; completely different sessions. The variance tells you whether you're in steady pressure or chasing gusts.
Finish with a ground check — look at trees, flags, and any visible vegetation at the waterline. Which branches are moving, and at what angle? This gives you a surface-level confirmation of wind direction that the water surface indicators may show from a slightly different vantage. If the trees say northwest and the cat's paws are moving southeast, you have a shear layer — the wind near the water surface differs from the wind higher up. That matters for how your wing will behave when you're standing on the board versus when you're foiling at speed and altitude.
If the forecast says 18 knots and your five-minute on-water wind assessment says 10, trust your assessment. You'll either choose appropriate gear, or you'll wait and watch conditions build — which is infinitely better than rigging for 18 and struggling in 10 for two hours.
If there's already someone on the water when you arrive, ask what the first 20 minutes felt like. The wing foiling community shares this kind of local knowledge freely — it's one of the sport's genuine gifts. What the water is saying and what your local community knows about how it says it: those two things together are the actual forecasting tool. Come find out what the water is telling you next time you pull into the launch. It's a more interesting conversation than anything you read at home.
Content ID: fcTV2Q4uSR8gi90ywiSGnLQI
See an error? Tell us.